当你不再需要通过别人的认可来证明自己的时候,你就真的强大了。请记住,守住内心的淡定与宁静,才能在茫茫的人生旅程中欣赏到美丽的风景。不必仰望别人,自己亦是风景。
本文通过Python3+pyqt5实现了python Qt GUI 快速编程的16章的excise例子。
#!/usr/bin/env python3

import random
import sys
from PyQt5.QtCore import (QAbstractListModel, QAbstractTableModel,
  QModelIndex, QSize, QTimer, QVariant, Qt,pyqtSignal)
from PyQt5.QtWidgets import (QApplication, QDialog, QHBoxLayout,
  QListView, QSpinBox, QStyledItemDelegate,QStyleOptionViewItem, QWidget)
from PyQt5.QtGui import QColor,QPainter,QPixmap

class BarGraphModel(QAbstractListModel):
 dataChanged=pyqtSignal(QModelIndex,QModelIndex)
 def __init__(self):
  super(BarGraphModel, self).__init__()
  self.__data = []
  self.__colors = {}
  self.minValue = 0
  self.maxValue = 0


 def rowCount(self, index=QModelIndex()):
  return len(self.__data)


 def insertRows(self, row, count):
  extra = row + count
  if extra >= len(self.__data):
   self.beginInsertRows(QModelIndex(), row, row + count - 1)
   self.__data.extend([0] * (extra - len(self.__data) + 1))
   self.endInsertRows()
   return True
  return False


 def flags(self, index):
  #return (QAbstractTableModel.flags(self, index)|Qt.ItemIsEditable)
  return (QAbstractListModel.flags(self, index)|Qt.ItemIsEditable)

 def setData(self, index, value, role=Qt.DisplayRole):
  row = index.row()
  if not index.isValid() or 0 > row >= len(self.__data):
   return False
  changed = False
  if role == Qt.DisplayRole:
   value = value
   self.__data[row] = value
   if self.minValue > value:
    self.minValue = value
   if self.maxValue < value:
    self.maxValue = value
   changed = True
  elif role == Qt.UserRole:
   self.__colors[row] = value
   #self.emit(SIGNAL("dataChanged(QModelIndex,QModelIndex)"),
   #   index, index)
   self.dataChanged[QModelIndex,QModelIndex].emit(index, index)
   changed = True
  if changed:
   #self.emit(SIGNAL("dataChanged(QModelIndex,QModelIndex)"),
    #   index, index)
   self.dataChanged[QModelIndex,QModelIndex].emit(index, index)
  return changed


 def data(self, index, role=Qt.DisplayRole):
  row = index.row()
  if not index.isValid() or 0 > row >= len(self.__data):
   return QVariant()
  if role == Qt.DisplayRole:
   return self.__data[row]
  if role == Qt.UserRole:
   return QVariant(self.__colors.get(row,
     QColor(Qt.red)))
  if role == Qt.DecorationRole:
   color = QColor(self.__colors.get(row,
     QColor(Qt.red)))
   pixmap = QPixmap(20, 20)
   pixmap.fill(color)
   return QVariant(pixmap)
  return QVariant()


class BarGraphDelegate(QStyledItemDelegate):

 def __init__(self, minimum=0, maximum=100, parent=None):
  super(BarGraphDelegate, self).__init__(parent)
  self.minimum = minimum
  self.maximum = maximum


 def paint(self, painter, option, index):
  myoption = QStyleOptionViewItem(option)
  myoption.displayAlignment |= (Qt.AlignRight|Qt.AlignVCenter)
  QStyledItemDelegate.paint(self, painter, myoption, index)


 def createEditor(self, parent, option, index):
  spinbox = QSpinBox(parent)
  spinbox.setRange(self.minimum, self.maximum)
  spinbox.setAlignment(Qt.AlignRight|Qt.AlignVCenter)
  return spinbox


 def setEditorData(self, editor, index):
  value = index.model().data(index, Qt.DisplayRole)
  editor.setValue(value)


 def setModelData(self, editor, model, index):
  editor.interpretText()
  model.setData(index, editor.value())


class BarGraphView(QWidget):

 WIDTH = 20

 def __init__(self, parent=None):
  super(BarGraphView, self).__init__(parent)
  self.model = None


 def setModel(self, model):
  self.model = model
  #self.connect(self.model,
  #  SIGNAL("dataChanged(QModelIndex,QModelIndex)"),
  #  self.update)
  self.model.dataChanged[QModelIndex,QModelIndex].connect(self.update)
  #self.connect(self.model, SIGNAL("modelReset()"), self.update)
  self.model.modelReset.connect(self.update)


 def sizeHint(self):
  return self.minimumSizeHint()


 def minimumSizeHint(self):
  if self.model is None:
   return QSize(BarGraphView.WIDTH * 10, 100)
  return QSize(BarGraphView.WIDTH * self.model.rowCount(), 100)


 def paintEvent(self, event):
  if self.model is None:
   return
  painter = QPainter(self)
  painter.setRenderHint(QPainter.Antialiasing)
  span = self.model.maxValue - self.model.minValue
  painter.setWindow(0, 0, BarGraphView.WIDTH * self.model.rowCount(),
       span)
  for row in range(self.model.rowCount()):
   x = row * BarGraphView.WIDTH
   index = self.model.index(row)
   color = QColor(self.model.data(index, Qt.UserRole))
   y = self.model.data(index)
   painter.fillRect(x, span - y, BarGraphView.WIDTH, y, color)


class MainForm(QDialog):

 def __init__(self, parent=None):
  super(MainForm, self).__init__(parent)

  self.model = BarGraphModel()
  self.barGraphView = BarGraphView()
  self.barGraphView.setModel(self.model)
  self.listView = QListView()
  self.listView.setModel(self.model)
  self.listView.setItemDelegate(BarGraphDelegate(0, 1000, self))
  self.listView.setMaximumWidth(100)
  self.listView.setEditTriggers(QListView.DoubleClicked|
          QListView.EditKeyPressed)
  layout = QHBoxLayout()
  layout.addWidget(self.listView)
  layout.addWidget(self.barGraphView, 1)
  self.setLayout(layout)

  self.setWindowTitle("Bar Grapher")
  QTimer.singleShot(0, self.initialLoad)


 def initialLoad(self):
  # Generate fake data
  count = 20
  self.model.insertRows(0, count - 1)
  for row in range(count):
   value = random.randint(1, 150)
   color = QColor(random.randint(0, 255), random.randint(0, 255),
       random.randint(0, 255))
   index = self.model.index(row)
   self.model.setData(index, value)
   self.model.setData(index, QVariant(color), Qt.UserRole)


app = QApplication(sys.argv)
form = MainForm()
form.resize(600, 400)
form.show()
app.exec_()
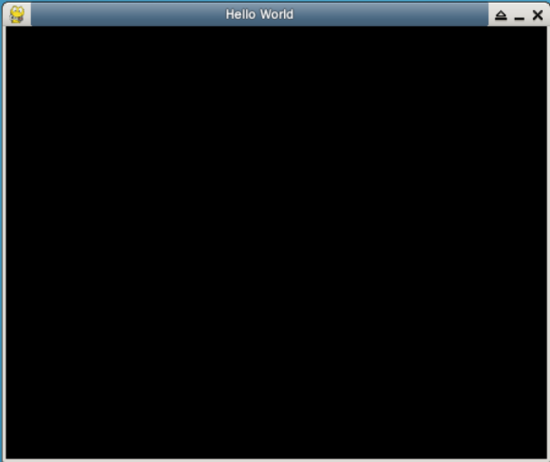
运行结果:
本文python3+PyQt5实现柱状图到此结束。青春不是人生的一段时期,而是心灵的一种状况。小编再次感谢大家对我们的支持!