如何使用monitory ios
2024-04-26 00:48:16
Monitor,解释为:(活动监视器)即实时显示CPU、内存和网络的使用情况,记录由虚拟内存大小测量的系统负载。用一句大白话来说,Activity Monitor类似Windows中的任务管理器,可以实时查看进程占用的CPU、内存的使用量。
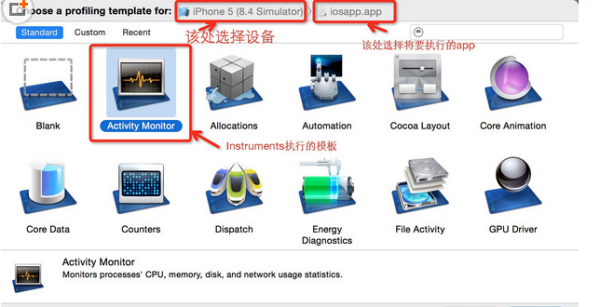
一. Monitor的介绍和大致使用具体操作步骤,首先从Xcode中运行Instruments,在顶部的菜单栏中,选择Product,选择Profile(快捷键:Command + I)。会调用Instruments,选择Activity Monitor 模板
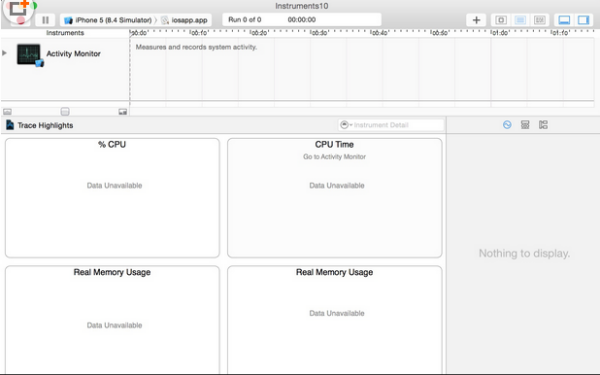
二.Monitor打开之后是这个样子,所有都是空的
三.当运行的设备和运行的app都准备好了,我们开始运行Activity Monitor,点击左上角的红色圆点按钮,开始记录手机中CPU和内存的使用情况,得到下图:
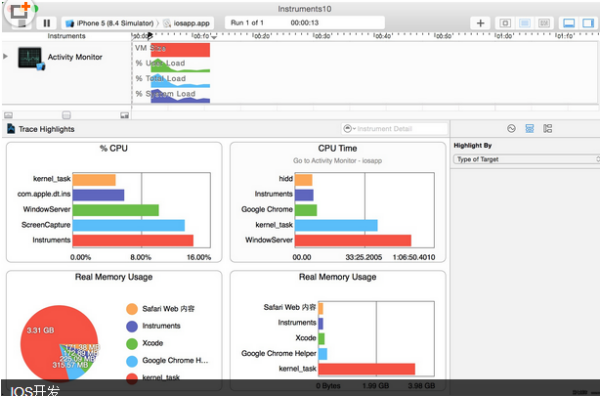
四.分析一下这些图的意思:%CPU:不同进程对CPU的占比CPU Time:CPU运行时间Real Memory Usage:进程使用的内存量,用了饼状图和柱状图展示 上图只是这些数据的大概结果可以去查看具体的数据,点击上图4个任意想要查看信息的图片,分析的结果有4种分析结果【Summary、Parent Child、Samples、Console】,一个个来分析 (1)Summary(Summary of data) ---------Process(进程)使用内存、CPU使用时长等摘要信息

五.其中参数的含义如下: process id ——进程id process name ——进程名 user name——用户名%CPU——cpu占比threads——线程real mem——真正使用的内存 virtual mem——虚拟内存architecture——架构 cpu time——CPU时间 sudden term——突然项(N/A:不适用) (2)Parent Child(
parent child information)-----父进程和子进程的关系,以及各个进程的概要信息

六.参数与Summary是一样的,内容也是一样的。但是具有层级关系(即父子关系),子进程在父进程的下一层级。(父进程上,可以展开、关闭所有子进程) (3)Samples(a list of samples) ----一系列抽样(即不同时间,CPU使用时间、内存使用情况的样本值)

七.参数的含义如下:
Physical Memory Wired——操作系统占用的内存
Physical Memory Active——除操作系统外其它进程占用的内存
Physical Memory Inactive——最近被释放的内存
Physical Memory Used——profiling当前进程时使用的总内存
Physical Memory Free——当前的可用内存
Total VM Size——虚拟内存的占用量
(1)Console,即控制台输出的日志(Log)信息
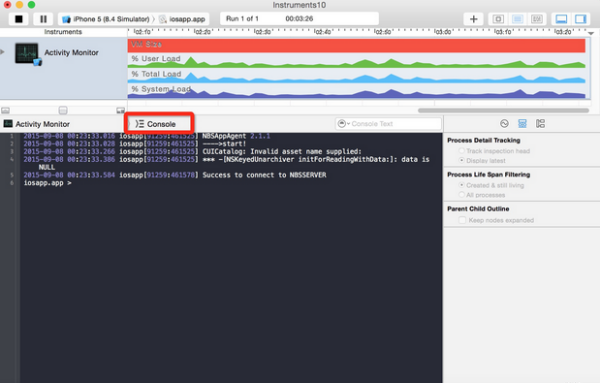
提示: Monitor默认配置了在Timeline面板中显示的内容,包括TotalVMSize、CPUTotalLoad、CPUUserLoad、CPUSystemLoad,在使用时可以根据需要选择相关的分析内容进行显示,并且不同的内存使用部分可以使用不同的颜色加以区分,下面就是Activity Monitor在使用过程中的界面截图,在右下角可选择内存相关的分析内容。
面我们将根据需要,对Activity Monitor监控的内容进行分类介绍: 二、 Monitor监控内存使用情况
(2)Examining Memory Usage with the Activity Monitor Trace Template
The Activity Monitor trace template monitors overall system activity and statistics, including CPU, memory, disk, and network. It consists of the Activity Monitor instrument only, although you can add additional instruments to a trace document you’ve created with the template, if you desire. You’ll see later that the Activity Monitor is also used to monitor network activity on iOS devices.
The Activity Monitor instrument captures information about the load on the system measured against the virtual memory size. It can record information from a single process or from all processes running on the system. The Activity Monitor instrument provides you with four convenient charts for a quick, visual representation of the collected information. The two charts that specifically describe memory usage are:
Real Memory Usage (bar graph). Shows the top five real memory users in a bar graph.
Real Memory Usage (pie chart). Shows the top five real memory users with the total memory used displayed.
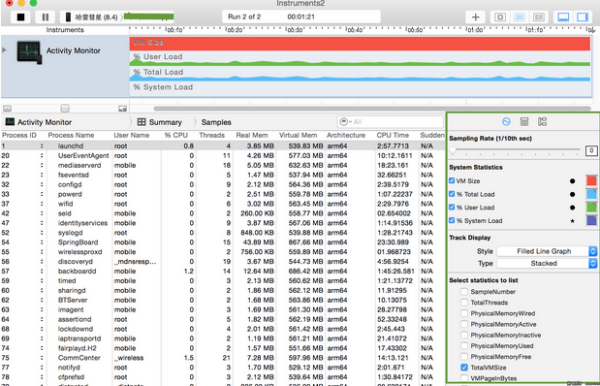
八.下图为Activity Monitor instrument with charts

The Record Settings area in the inspector sidebar includes a list of system statistics, which can be configured to appear in the track pane and graphically represent collected data. Select a statistic’s checkbox to see it graphed in the track pane. Click the shape or the color well to change how a statistic appears in the track pane.

There are a number of statistics the Activity Monitor instrument supports, but the following ones are network-specific:
Net Packets In
Net Bytes In
Net Packets Out
Net Bytes Out
Net Packets In Per Second
Net Packets Out Per Second
Net Bytes In Per Second
Net Bytes Out Per Second
If one of the statistics above doesn’t appear under System Statistics in the Record Settings inspector, locate itunder “Select statistics to list” and click its checkbox to include it in the list.
Once you have gathered network activity for your app, examine it carefully to pinpoint areas where your app is sending out excessive amounts of information and therefore tying up valuable device resources. When you minimize the amount of information sent and received, you can benefit from increased performance and response times in your app.
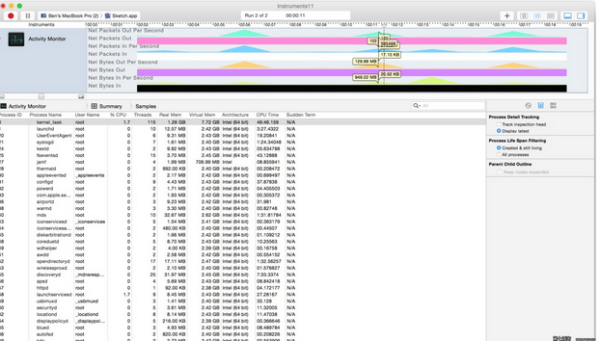
九.下图为Activity Monitor instrument tracing network packets
热门标签