山有山的沉稳厚重,一年四季却能以不同的色彩风光展示山的美丽。活泼的有单调的一面,安静的有变换的色彩。静与动的搭配,单调与精彩的结合,也就组成了最美的风景。
1.在组件中创建该模块
<template>
 <div id = "testChart"></div>
</template>
2.导入echarts
前提是:已经在项目中配置过echarts
在<script></script>中导入echarts
<script>
import {echartInit} from "../../../utils/echartUtils"
</script>
3.初始化该模块
 export default {
  name: 'Test',  //vue该组件名称Test.vue
  mounted() {
   this.testChart = echartInit('testChart');  //初始化该echarts表
   /*this.testChart.setOption(this.option); */  // 如果是写死的数据,可以在这儿setOption()看效果
  },
}
4.将data中的option数据返回
在返回的数据(请求的数据)成功后加入setOption();
如果是写死的数据,可以在mounted中直接加入setOption()看结果;
如下为动态数据获取
export default{
data() {
   return {
    option: {
     "grid": {
      "height": "67%",
      "right": "10%",
      "top": "8%",
      "width": "83%"
     },
     "legend": {
      "data": ['新增','完成','未完成'],
      bottom: '5%'
     },
     "series": [
      {
       name: '新增',
       type: 'line',
       /*areaStyle: {},*/
       smooth: false,
       data: []
      },
      {
       name: '完成',
       type: 'line',
       /*areaStyle: {},*/  //折线下显示填充色
       smooth: false,
       data: []     //可以写固定的数据
      },
      {
       name: '未完成',
       type: 'line',
       smooth: false,  // 折线,false不平滑的折线,true平滑的曲线
       data: []      //可以写固定的数据
      },
     ],
     "toolbox": {
      "emphasis": {
       "iconStyle": {
        "textAlign": "right",
        "textPosition": "left"
       }
      },

      "orient": "vertical",
      "right": "2%",
      "show": true,
      "textStyle": {
       "align": "left"
      }
     },
     "tooltip": {
      "axisPointer": {
       "type": "shadow"
      },
      "trigger": "axis"
     },
     "xAxis": {
      "axisLine": {
       "lineStyle": {
        "color": "rgb(0, 138, 205)"
       }
      },
      "boundaryGap": true,
      "data": [],     //可以写固定的数据
      "splitLine": {
       "show": false
      },
      "splitNumber": 1,
      "type": "category"
     },
     "yAxis": {
      "min": 0,
      "splitNumber": 8,
      "type": "value"
     }
    },
    testChart: {}
   }
},
}
5.通过getData()向后台获取数据并返回,将获取的数据返回setOption()
this.testChart.setOption(this.option);
补充知识:vue+echarts踩过的坑
vue+echarts踩过的坑
文字显示居中:可以修改label的padding(只限修改个别地区)设置padding
地图只显示某一部分地区四个省份
用到了geo中regions(用了一整张中国地图,放大这四个地区某个中心点)
geo: {
map: “china”,
mapLocation: {
x: ‘center'
},
center: [“115.892151”, “28.676493”],
zoom:4.8,
label: {
normal:{
show:false
},
emphasis: {
show: false
}
},
roam: false,
itemStyle: {
normal: {
areaColor: “#fff”, //地图默认的背景颜色
borderColor: “#fff”,//地图默认的边线颜色,
opacity:0
},
emphasis: {
areaColor: “#fff”,//地图触发地区的背景颜色
}
},
regions: [
{
name: “浙江”,
label: {
normal:{
show:true,
fontSize:16,
color:'#fff',
padding:[100,4,4,4]
},
emphasis: {
show: true
},
// label:{
// formatter:'{b}',
// }
},
itemStyle: {
normal: {
areaColor: “#1FB2A8”,
borderWidth:4,
borderColor:'#fff',
opacity:1
},
emphasis: {
areaColor: “orange”, //地图触发地区的背景颜色
borderWidth:4,
borderColor:'#fff',
}
}
},
{
name: “江西”,
label: {
normal:{
show:true,
fontSize:16,
color:'#fff',
padding:[100,20,4,4]
},
emphasis: {
show: false
}
},
itemStyle: {
normal: {
areaColor: “#1FB2A8”,
borderWidth:4,
borderColor:'#fff',
opacity:1
},
emphasis: {
areaColor: “orange”, //地图触发地区的背景颜色
borderWidth:4,
borderColor:'#fff'
}
}
},
{
name: “福建”,
label: {
normal:{
show:true,
fontSize:16,
color:'#fff',
padding:[0,70,0,0]
},
emphasis: {
show: false
}
},
itemStyle: {
normal: {
areaColor: “#1FB2A8”,
borderWidth:4,
borderColor:'#fff',
opacity:1
},
emphasis: {
areaColor: “orange”, //地图触发地区的背景颜色
borderWidth:4,
borderColor:'#fff'
}
}
},
{
name: “上海”,
label: {
normal:{
show:true,
fontSize:10,
color:'#fff',
padding:[15,0,0,0]
},
emphasis: {
show: false
}
},
itemStyle: {
normal: {
areaColor: “#1FB2A8”,
borderWidth:4,
borderColor:'#fff',
opacity:1
},
emphasis: {
areaColor: “orange” ,//地图触发地区的背景颜色
borderWidth:4,
borderColor:'#fff'
}
}
}
]
},
series: [
{
type: ‘map',
coordinateSystem: ‘geo',
},
{
type: ‘map',
geoIndex: 0,
data:datass
}
],
显示问题
formatter: function (params) {
// console.log(params)
var res='';
var name='';
for (var i = 0; i < datass.length; i++) {
if (datass[i].name == params.name) {
name=<p class="big">+datass[i].name+</p>
if(datass[i].value==''){
res=''
}else{
datass[i].value.forEach(element => {
res+=<p class="small">+element+</p>
});
}
}
}
return name+res
},
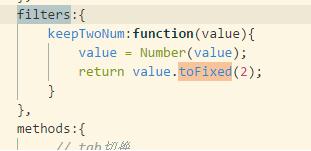
y轴显示百分号
axisLabel: {
formatter: ‘{value}%'
}
以上这篇在项目vue中使用echarts的操作步骤就是小编分享给大家的全部内容了,希望能给大家一个参考,也希望大家多多支持。