只有相信自己的目标,努力工作和奋斗的人才能取得最终的成功。但是我一直相信的一件事是,当您触摸自己哭泣时,您就成功了!
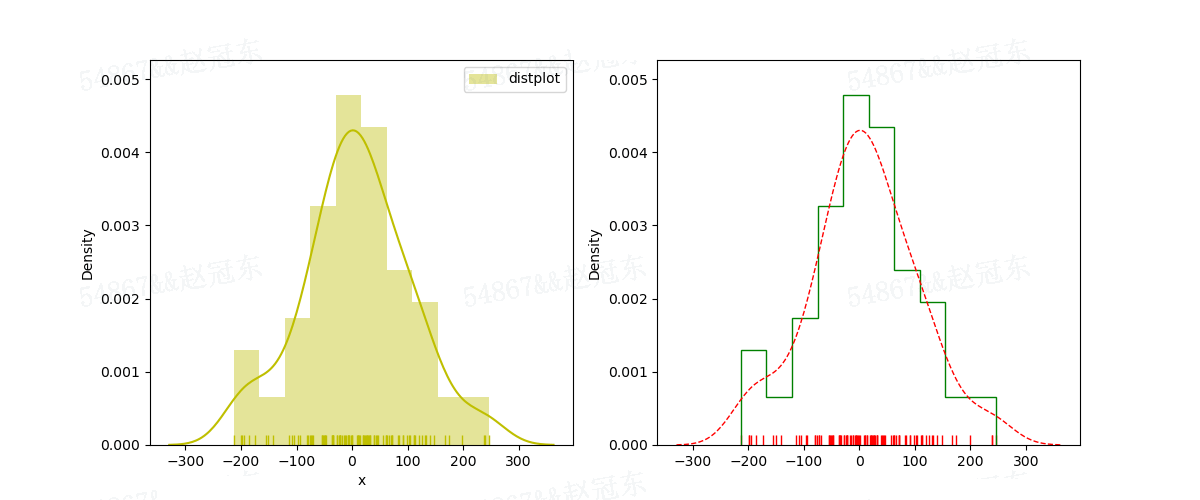
一、直方图distplot()
import numpy as np
import seaborn as sns
import matplotlib.pyplot as plt
import matplotlib
import pandas as pd

fig = plt.figure(figsize=(12, 5))
ax1 = plt.subplot(121)
rs = np.random.RandomState(10)  # 设定随机数种子
s = pd.Series(rs.randn(100) * 100)
sns.distplot(s, bins=10, hist=True, kde=True, rug=True, norm_hist=False, color='y', label='distplot', axlabel='x')
plt.legend()

ax1 = plt.subplot(122)
sns.distplot(s, rug=True,
             hist_kws={"histtype": "step", "linewidth": 1, "alpha": 1, "color": "g"},  # 设置箱子的风格、线宽、透明度、颜色,风格包括:'bar', 'barstacked', 'step', 'stepfilled'
             kde_kws={"color": "r", "linewidth": 1, "label": "KDE", 'linestyle': '--'},   # 设置密度曲线颜色,线宽,标注、线形
             rug_kws={'color': 'r'})  # 设置数据频率分布颜色
plt.show()
函数及参数介绍:
distplot(a, bins=None, hist=True, kde=True, rug=False, fit=None,hist_kws=None,
	 	 kde_kws=None, rug_kws=None, fit_kws=None, color=None,  vertical=False,
		 norm_hist=False, axlabel=None, label=None, ax=None)
- a 数据源
- bins 箱数hist、kde、rug 是否显示箱数、密度曲线、数据分布,默认显示箱数和密度曲线不显示数据分析
- {hist,kde,rug}_kws 通过字典形式设置箱数、密度曲线、数据分布的各个特征
- norm_hist 直方图的高度是否显示密度,默认显示计数,如果kde设置为True高度也会显示为密度
- color 颜色
- vertical 是否在y轴上显示图标,默认为False即在x轴显示,即竖直显示
- axlabel 坐标轴标签
- label 直方图标签
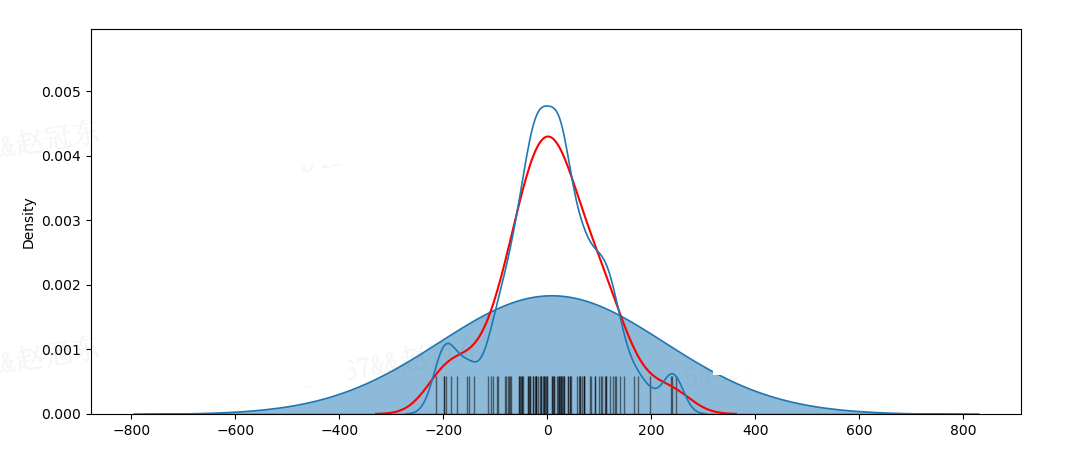
二、密度图
2.1 单个样本数据分布密度图
到此这篇关于python使用seaborn绘图直方图displot,密度图,散点图的文章就介绍到这了,更多相关python seaborn绘图 内容请搜索以前的文章或继续浏览下面的相关文章希望大家以后多多支持!